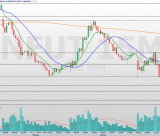
Nasdaq 100 (NQ) Analysis, Key-Zones, Setup for Thu (Nov 19)

Bias: The December Nasdaq-100 contract settled at 27,186.75 on Wednesday, up 111.25 or 0.41 percent, after trading between 27,609.75 and 26,921.75, a 688.00 point range, the narrowest since 11/12/26. Wednesday printed a higher high and a higher low against Tuesday and the first higher settle after four consecutive lower settles, while the cash index rose 0.42 percent against a 0.23 percent decline in the S&P 500. The session high printed in the first half hour after Tuesday’s reopen, and the provider’s market commentary said NVIDIA erased an overnight rally and closed down more than 2 percent, pressuring chipmakers, which is attributed commentary. On the 30-minute series the low printed in the 11:00 AM ET bar and the largest gain came in the 12:00 PM ET bar. The FOMC minutes at 2:00 PM ET showed, per a news-feed headline, that a couple of participants said a December hike of more than 25 basis points may be warranted, and the ten-year yield index eased to 5.07 as the dollar index rose to 103.86. On the dealer-positioning data the cash close sits 116.26 above the 27,000 put side support base, the largest gamma concentration, which converts to about 27,070.50 in futures at this review’s 70.49 basis, while the modeled volatility threshold moved down to 28,000 and the modeled gamma-flip level to 27,756. The fund’s options show negative gamma on both calls and puts, in this review’s interpretation a condition that may add to moves in either direction. The composite multi-indicator read is 88 percent sell with good strength, unchanged from a session earlier, and the settle sits beneath every settlement average from the 5-day to the 200-day. In this review’s interpretation the bias is lower beneath Pivot R1 at 27,557.08, with a rebound toward the 27,550 to 27,600 band the more likely first test and a return toward the converted 27,000 base the base case. US jobless claims and the Philadelphia Fed survey are listed for 8:30 AM ET on Thursday by the news-feed calendar, unconfirmed, and the AI-developer offering for 9:30 AM ET on Thursday as tentative, unconfirmed.
Resistance:
– 28,070.50 modeled volatility threshold, futures equivalent
– 27,927.42 Pivot R2
– 27,826.50 modeled gamma-flip level, futures equivalent
– 27,767.65 one standard deviation resistance
– 27,708.22 9-day settlement average
– 27,636.39 stochastic stall projection
– 27,609.75 Wednesday’s session high
– 27,593.15 5-day settlement average
– 27,557.08 Pivot R1
– 27,239.42 Pivot Point
Support:
– 27,174.00 Thursday’s reopening print
– 27,085.25 stall projection
– 27,070.50 primary put side support base, futures equivalent
– 26,921.75 Wednesday’s session low
– 26,895.69 provider target price
– 26,869.08 Pivot S1
– 26,658.50 Tuesday’s session low
– 26,605.85 one standard deviation support
– 26,551.42 Pivot S2
Primary Setup: SHORT the December contract from the 27,550 to 27,600 band, at Pivot R1 at 27,557.08 and straddling the 27,593.15 5-day average with its 27,575 midpoint beneath it. Stop 27,700, above the 27,636.39 stall projection. Targets at 27,450 first, 27,325 second, above the Pivot Point at 27,239.42, and 27,200 third, above Wednesday’s 27,186.75 settle. Risk to reward is roughly 1:1 to the first objective, 1:2 to the second and 1:3 to the third from the entry midpoint. The 14-day average true range is 820.50 points against a 125 point stop distance. A settle above the 27,708.22 9-day average negates the thesis; two consecutive 30-minute closes above 27,600 remove the edge before the stop is reached. A strong reception for the AI-developer offering or softer data at 8:30 AM ET can carry price through the stop in one move, which makes this an analyst judgment that rebounds are sold while the averages hold. All levels are the December contract’s, which the provider lists as expiring on 12/18/26.
Wednesday’s 27,186.75 settle sat beneath the middle of a range that made a higher high and a higher low, and the December contract reopened 12.75 lower. In this review’s interpretation Thursday is a test of whether a rebound stalls beneath the 27,636.39 stall projection, or whether a break of Wednesday’s 26,921.75 low could carry the contract toward Tuesday’s 26,658.50 low.