


USDJPY — H1 Intraday: Short the Bounce Into 159.612-159.697
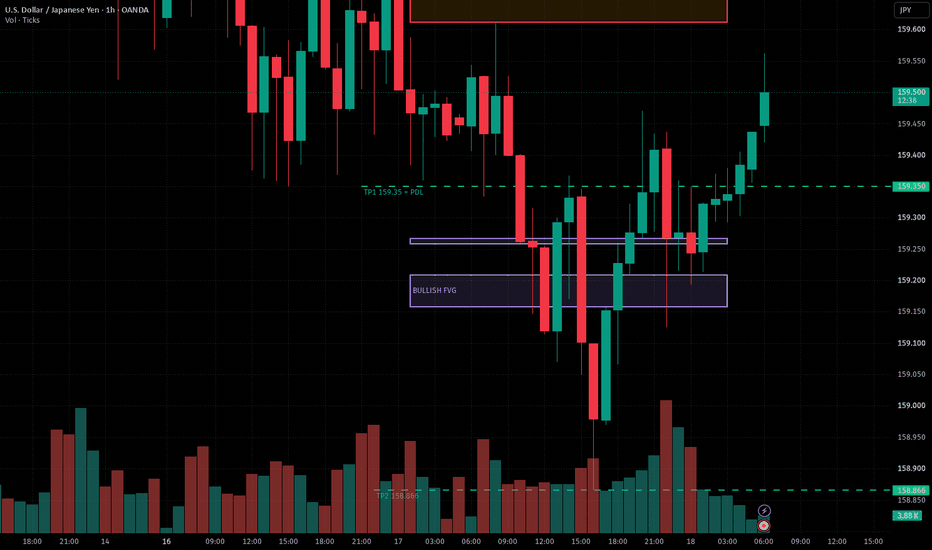
1. Thesis
USDJPY is bullish on D1 but bearish on H1 and ranging on H4 — a mixed, range context. Price sits below H1 EMA20/EMA50 after falling from the 160.192 swing high to 158.866. The plan is to short a bounce into the H1 resistance cluster 159.612–159.697 (recent swing highs), with invalidation above PDH 159.894. R:R is only attractive near the top of the zone.
2. Market context (live data, verified 06:40 VN Wed 18 Nov 2026; prep export 2026-11-17T17:21:00Z)
– D1: BULLISH. Close 159.432; EMA20 158.568, EMA50 158.269, EMA200 157.825; RSI14 58.8; ATR14 0.913.
– H4: RANGE. Close 159.34; EMA20 159.424, EMA50 159.074, EMA200 158.057; RSI14 49.5; ATR14 0.346.
– H1: BEARISH. Close 159.276 (prep); latest completed H1 candle 22:00–23:00 UTC 17 Nov: O 159.378, H 159.437, L 159.356, C 159.437; EMA20 159.317, EMA50 159.439, EMA200 159.057; RSI14 46.5; ATR14 0.182.
– M15: RANGE. Close 159.237 (prep); latest completed M15 candle 23:15–23:30 UTC 17 Nov: O 159.498, H 159.503, L 159.454, C 159.495; EMA20 159.284, EMA50 159.277, EMA200 159.479; RSI14 46.6; ATR14 0.102.
– Live price at final check: 159.550 at 06:40 VN (sell 159.542 / buy 159.559). Market open and ticking.
– Preliminary score 60/80 (not a win probability).
3. Key levels (verified against the chart)
– PDH 159.894 / PDL 159.35 (last completed daily bar, 2026-11-15 22:00 UTC).
– Resistance: 159.612–159.697 (swing highs Nov 17 01:00 / Nov 16 10:00).
– Support: 158.866 (swing low Nov 17 09:00); 158.684 (projection).
– FVGs (geometric observations, not validated order blocks): bullish 159.158–159.209; bullish 159.258–159.267.
4. Trade plan (CONDITIONAL — not a filled trade)
– Direction: SHORT. Entry zone 159.612–159.697. Stop 159.894. TP1 159.35. TP2 158.866. TP3 158.684.
– R:R at both ends of the entry zone (verified): TP1 0.93R at 159.612 / 1.76R at 159.697; TP2 2.65R / 4.22R; TP3 3.29R / 5.14R.
– Risk/Reward Quality: ACCEPTABLE (TP1 R:R at the adverse edge). R:R alone is not a statistical edge.
– Entry requires an M15 rejection (closed candle) inside the zone; no trigger, no trade.
5. Entry triggers (M15)
M15 closed-candle rejection (long upper wick / bearish engulfing) at 159.612–159.697, or a break-and-retest of 159.612 from below. No M15 confirmation was observed at check time. Price was below the zone (159.550) at 06:40 VN.
6. Invalidation
H1 close above 159.894 (PDH) invalidates the short. Stop 159.894 is the hard exit.
7. Alternative scenario
H1 close above PDH 159.894 flips the bias: the D1 uptrend resumes and long on a reclaim of 159.894 becomes the view, first target 160.048 (Nov 12 swing high). No long is active while price is below PDH.
8. Risk management
Position size is not specified here; risk per idea is capped by the account’s own rules. R:R alone is not a statistical edge and the preliminary score is not a win probability. This is analysis, not a trade signal and not financial advice.
9. Data & verification
– Feed: OANDA:USDJPY via TradingView chart export (Table view, Download data) + live chart re-verification 06:28–06:40 VN 18 Nov 2026.
– Scan: OANDA_USDJPY_20261117T174046Z (generated 2026-11-17T17:40:46Z); source SOURCE_VERIFIED_REQUIRES_CHART_QA.
– Visual plan 245cc59d-086d-47a1-aae9-baaa5311a1fe (TRADE_SETUP, 13 objects); preflight PASS; visual QA PASS (all 8 items).
– Latest closed bars at export: D1 2026-11-15T22:00:00Z, H4 2026-11-17T10:00:00Z, H1 2026-11-17T16:00:00Z, M15 2026-11-17T17:00:00Z; re-verified live at publication (H1 completed 23:00Z, M15 completed 23:30Z, quote 23:40Z).
– Pivots 5/5 confirmed. FVGs are geometric observations, not validated order blocks.
10. Publication note
CONDITIONAL H1 intraday analysis for VN 2026-11-18. Entry only on M15 confirmation inside 159.612–159.697. If the structure changes, this idea is not updated into a different trade — a new analysis would be needed.


