

NYKAA 1M: Closed Above Its Rising Resistance Line
FSN E-Commerce Ventures Ltd. NSE:NYKAA
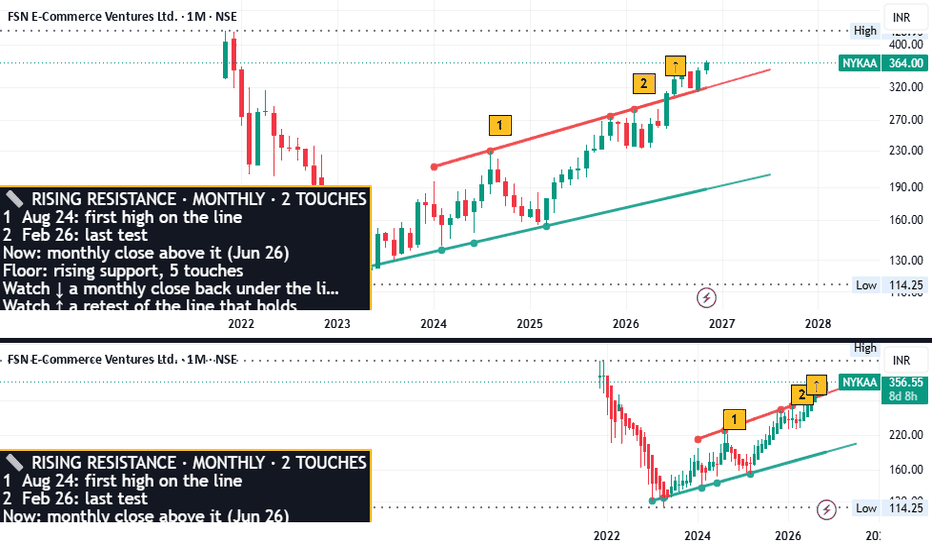
NYKAA, monthly: the chart’s own swing highs line up on a rising resistance line. Drawn by an automated trendline scan on a log price scale.
What the chart shows
- The rising resistance line has been touched 2 times, first on 1 Aug 24, last on 2 Feb 26.
- The newest closed candle (1 Oct 26) closed above the line.
- The 1 Aug 24 touch, the one old enough to count, held for ten monthly candles.
- Rising floor on the other side: 5 touches, the latest on 3 Mar 25.
- The two lines run close to parallel – together they frame a channel.
- Newest closed candle (1 Oct 26): closed just above the resistance line.
Worth watching
- The line stands as long as the monthly closes stay below it.
- A monthly close above the resistance line ends this reading.
- A monthly close below the rising floor.
- Whichever comes first gets an update under this idea – a hold or a break.
Your read?
2nd touch of a rising resistance line: more likely to hold, or weaker each time?
Part of “NSE Lines · monthly” – an update follows either way. For study only. Not investment advice. The author is not SEBI registered.



