HOW-TO: Gold (XAUUSD) Macro Breakdown & 3 Scenarios
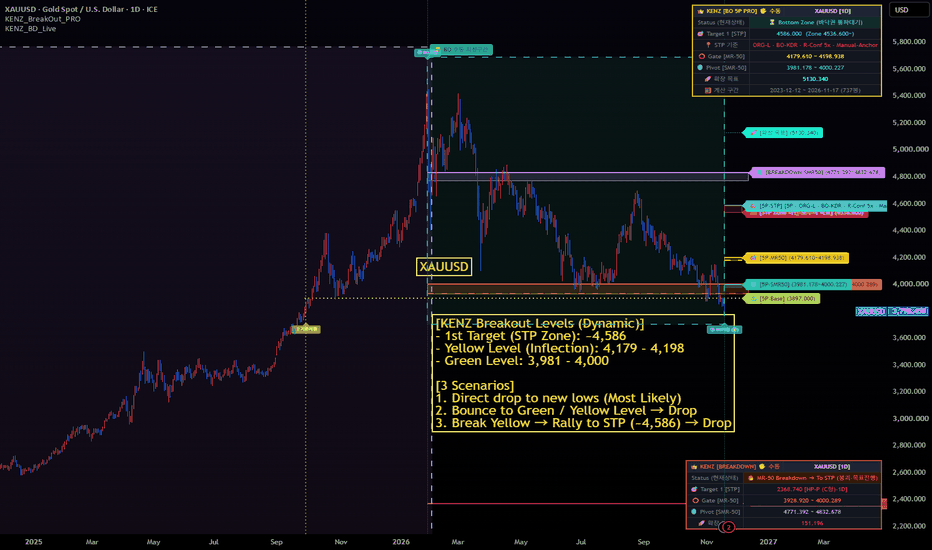
1. Macro Uptrend Over: KENZ Breakdown Orange Zone Breached
The long-standing uptrend in Gold (XAUUSD) appears to have cautiously come to an end. On the KENZ Breakdown indicator, the Orange Zone marks the structural level where an upward wave breaks down. Since price broke below this zone a few days ago, the broader downside path toward the 2,300 – 2,600 region is now open.
2. Wave Mechanics: How Next Lows Are Calculated
In every chart, key highs and lows are structurally determined once a major trend-breaking trigger fires. While an uptrend remains intact, it is impossible to know where the next macro bottom will form. However, once a confirmed breakdown occurs (breaching the Breakdown Orange Level), the wave magnitude mathematically projects the next downside target zone—which I currently see between 2,300 and 2,600.
To be clear, this does not mean Gold will crash to those levels tomorrow. It simply means the macro uptrend is over, and we are at the very beginning of a broader downtrend phase.
3. Tracking Short-Term Bounces with KENZ Breakout
Whether price drops straight down or zigzags lower, the KENZ Breakout indicator helps map the counter-trend bounce structure:
– Breaking above the Green Level opens upside room toward the Yellow Level.
– Breaking above the Yellow Level opens a move up to the STP Zone (1st Target).
Current Dynamic Levels (based on today’s low):
– Green Level: 3,981 – 4,000
– Yellow Level (Key Inflection): 4,179 – 4,198
– 1st Target (STP Zone): ~4,586
(Note: Today printed a fresh low. If XAUUSD continues making new lows, KENZ Breakout will dynamically recalculate and adjust all level prices accordingly.)
The single most important level to watch is the Yellow Level (4,179 – 4,198)—treat this as the primary short-term trend inflection point.
4. 3 Scenarios Ahead for XAUUSD
– Scenario 1 (Most Probable): Price breaks below today’s low immediately and extends the downtrend.
– Scenario 2: Price bounces to the Green Level (3,981 – 4,000) or Yellow Level (4,179 – 4,198), gets rejected, and resumes dropping.
– Scenario 3: Price breaks above the Yellow Level, rallies to the STP Zone (~4,586), and then rolls over into the main downtrend.
Based on current wave momentum, Scenario 1 looks slightly more probable at this stage.
5. Takeaway
With the macro uptrend broken, avoid forcing aggressive long positions. Keep your focus on whether price can break and hold above the Yellow Level (4,179 – 4,198) before considering any bullish shift.