


GOLD 4H – Key Demand Reaction & Potential Bullish Reversal
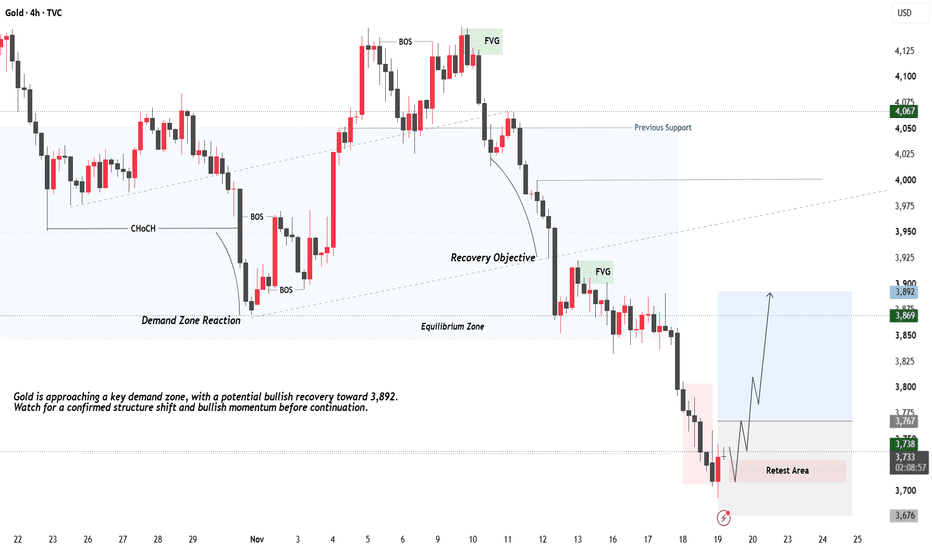
GOLD (XAUUSD) – 4H DEMAND ZONE REACTION & POTENTIAL BULLISH RECOVERY
Gold is approaching a technically important demand area following the recent bearish move. The current chart highlights key structural levels, potential price reactions, and an alternative bullish recovery scenario. The main focus is to observe whether buyers can establish control and drive price toward the projected upside levels.
Step-by-Step Technical Breakdown
1. Current Market Structure
Gold has experienced notable bearish pressure. Price action around the highlighted support area will be important in determining whether the market continues lower or begins a corrective recovery.
2. Major Demand Zone
The middle long rectangle identifies an important demand and support region. This area deserves close attention because a strong buying response could create the foundation for a potential bullish recovery.
3. FVG – Fair Value Gap
The marked Fair Value Gap represents an imbalance area that price may revisit. Monitor how price reacts around this region for potential rejection or continuation signals.
4. Key Structural Resistance
The horizontal line beneath the FVG marks an important structural level. A successful reclaim and sustained move above this level could strengthen the bullish recovery scenario.
5. Projected Bullish Recovery Path
The left curved projection illustrates a possible upside recovery from the demand region. This scenario depends on buyers demonstrating strength and establishing a bullish market structure shift.
6. Upside Projection – 3,892
The right-side projected area represents the potential recovery objective. Price may attempt to move toward this region if bullish momentum develops and intermediate resistance levels are successfully reclaimed.
7. Confirmation Before Entry
Watch for:
– Strong bullish rejection from demand.
– Higher highs and higher lows.
– A confirmed bullish break of structure.
– Strong bullish candle closes.
– Successful resistance retests.
These signals can help distinguish a genuine recovery from a temporary pullback.
8. Risk Management
Avoid anticipating the projected move without confirmation. Define invalidation levels, maintain appropriate position sizing, and protect capital throughout the trade.
FINAL MARKET OUTLOOK
The chart presents a potential bullish recovery scenario from a key demand region, with 3,892 identified as the projected upside objective. The critical factor is whether buyers can defend support, reclaim structural resistance, and establish sustainable bullish momentum.
Patience. Precision. Discipline. Consistency.



