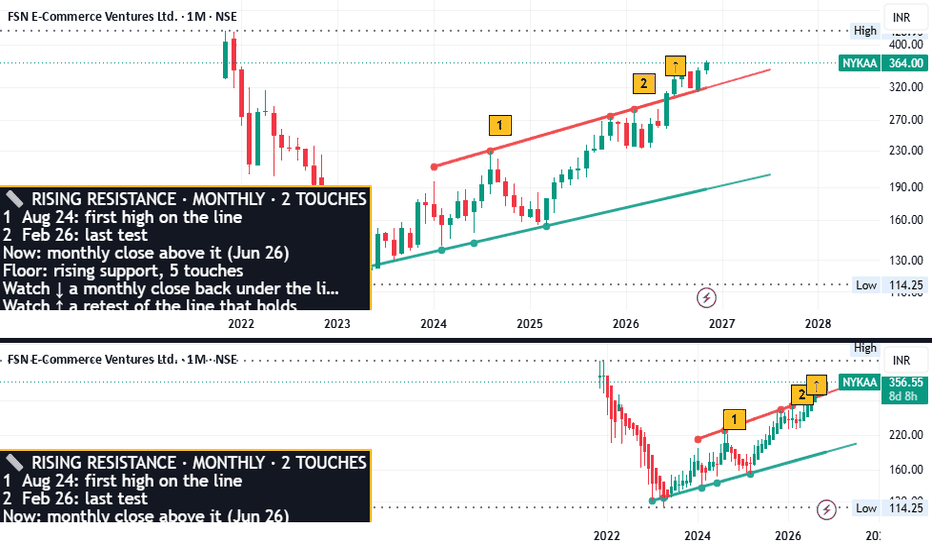
NYKAA 1M: Closed Above Its Rising Resistance Line

NYKAA 1M: Closed Above Its Rising Resistance Line


NYKAA, monthly: the chart’s own swing highs line up on a rising resistance line. Drawn by an automated trendline scan on a log price scale.

What the chart shows

  • The rising resistance line has been touched 2 times, first on 1 Aug 24, last on 2 Feb 26.
  • The newest closed candle (1 Oct 26) closed above the line.
  • The 1 Aug 24 touch, the one old enough to count, held for ten monthly candles.
  • Rising floor on the other side: 5 touches, the latest on 3 Mar 25.
  • The two lines run close to parallel – together they frame a channel.
  • Newest closed candle (1 Oct 26): closed just above the resistance line.

Worth watching

  • The line stands as long as the monthly closes stay below it.
  • A monthly close above the resistance line ends this reading.
  • A monthly close below the rising floor.
  • Whichever comes first gets an update under this idea – a hold or a break.

Your read?
2nd touch of a rising resistance line: more likely to hold, or weaker each time?

Part of “NSE Lines · monthly” – an update follows either way. For study only. Not investment advice. The author is not SEBI registered.

Previous Article

DXY Weekly Outlook | 23–27 November 2026

Next Article

Gold (XAUUSD) Weekly Outlook | 23–27 November 2026

You might be interested in …

Pfizer breaks below $28.50

Pfizer breaks below $28.50 Pfizer Inc. BATS:PFE FxPro – Pfizer broke support zone – Likely to fall to support level 27.00 Pfizer recently broke the support zone between the support level 28.50, the 38.2% Fibonacci correction of the upward impulse from the start of July and the daily up trendline from August. The level 28.50 capped the price at the […]

Intuit Overnight Drop Puts $279.66 Support to the Test

Intuit Overnight Drop Puts $279.66 Support to the Test Intuit Inc. BATS:INTU ArslanAliButt Intuit closed Thursday at $310.02, down 1.03%, but overnight trading has it near $279.96, pointing to a sharp gap lower at the open. The daily picture was already fragile before that. The stock stalled near $341.23 earlier in November and has since slipped under both moving averages […]

XRPUSDT Analyses-97, November 18, 2026

XRPUSDT Analyses-97, November 18, 2026 XRP / TetherUS BINANCE:XRPUSDT EhsanZeydabadi 📊 XRPUSDT – Range Compression Before a Potential Breakout 📉 XRP remains within a broader bearish structure on the 1H timeframe, while the recent recovery has broken the descending trendline. 📍 Price is consolidating between 0.9430 and 0.9742, with the current price around 0.9688. 🔹 Key Levels: 🔴 1.0419 – […]

Deixe um comentário

O seu endereço de e-mail não será publicado. Campos obrigatórios são marcados com *