


Reading Market Leadership & Alt Flow: ETHBTC & BTCUSDT
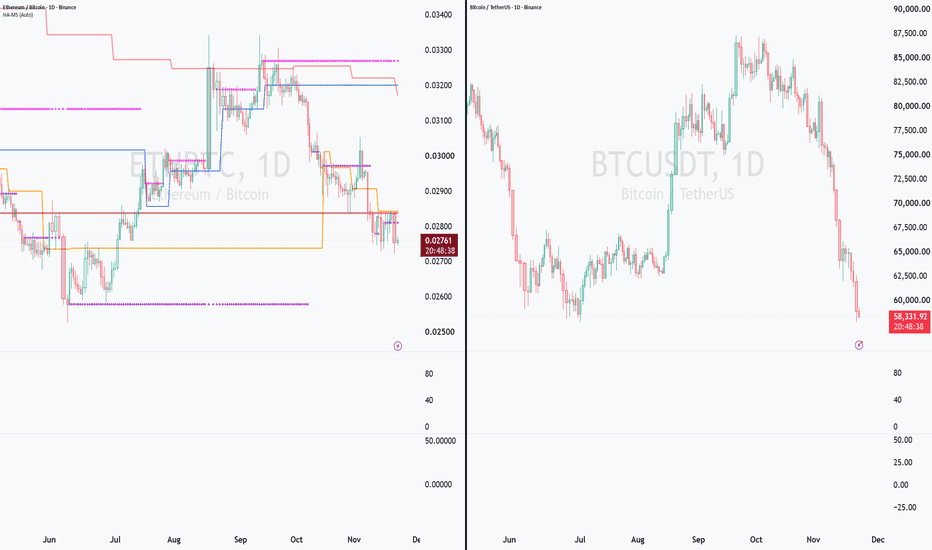
Hello, traders! Welcome.
If you hit “Follow,” you can always stay updated with the latest insights quickly.
Have a great day today.
————————————-

Just by combining ETHBTC and BTCUSDT, you can largely determine whether the market is Bitcoin (BTC)-driven or if capital flow is spreading toward Ethereum and altcoins.
However, since these two charts alone only show relative strength against ETH and serve as an indirect signal for whether capital is rotating into mid- and small-cap altcoins as a whole, it is more accurate to check BTC.D (Bitcoin Dominance) or TOTAL3 (Total Crypto Market Cap excluding BTC and ETH) alongside them.
When three conditions align simultaneously—ETHBTC rising (+1) + BTC.D falling (+1) + TOTAL3 rising (+1)—the score reaches +3, confirming that liquidity is expanding across the broader altcoin market rather than just isolated ETH strength.
Conversely, if the score stays in the -2 to -3 range, BTC.D is rising while ETHBTC is suppressed, indicating BTC dominance or a risk-off market phase.
It is best to filter out sideways (ranging) markets using the ADX and CHOP indicators.
By default, setting ADX >= 20 and CHOP <= 61.8 is recommended to confirm whether the market has broken out of a ranging phase.
Once the market enters a sideways phase, price momentum slows down and frequent false crossovers occur.
If you are not yet accustomed to reading the ETHBTC chart, interpreting it in real time can be confusing, so you should practice checking the live ETHBTC chart alongside the BTCUSDT chart regularly.
1. ETHBTC Down, BTCUSDT Down: Corresponds to BTC defensive dominance / deepening altcoin weakness. Amid broader market risk-off sentiment, altcoins are likely to experience sharper volatility and drawdowns than BTC.
2. ETHBTC Up, BTCUSDT Up: Corresponds to an expanding bull market / early rotation phase. Following BTC’s rally, capital has strong room to flow into ETH and large-cap altcoins.
3. ETHBTC Down, BTCUSDT Up: Corresponds to a classic BTC-dominant rally. Capital concentrates heavily into BTC, and even if altcoins rise, their gains tend to lag behind BTC or remain sidelined.
4. ETHBTC Up, BTCUSDT Down: Corresponds to relative ETH resilience or an asymmetric bounce. Either BTC is dropping sharply or isolated ETH demand is holding up, so it is too early to conclude a broad uptrend across all altcoins.
5. ETHBTC Up, BTCUSDT Sideways: Corresponds to a BTC breather + altcoin rotation attempt. While BTC consolidates, short-term liquidity and volatility may flow into ETH and altcoins.
—
Thank you for reading until the end.
Wishing you successful trading!
————————————————–


