


Is The AI Bubble Ending, Or Is This A Healthy Correction ?
IS THE AI BUBBLE ENDING, OR IS THIS A HEALTHY CORRECTION?
The recent selloff across AI stocks naturally raises the same question: are NVIDIA, Palantir and Broadcom signaling the end of the broader AI trend, or are we simply seeing a healthy correction after several years of extraordinary expansion? From a long term technical perspective, I currently lean toward the second scenario. All three stocks have pulled back significantly from their highs, but there is an important distinction: a sharp decline is not the same as a long term trend breakdown.

NVIDIA is the clearest example. The stock has been building a powerful rising trend since early 2023. Throughout 2024 and 2025, price expanded far above that primary trend and the move became increasingly steep. The decline from the 2026 peak near $240 is now bringing price back toward that long term structure. NVIDIA has fallen toward the $150 area, while the rising trend support from 2023 is approaching the same region. That makes the current area technically important. After spending several years trading above its underlying trend, NVIDIA is now undergoing one of its first major mean reversions back toward the primary structure.
If that trend holds and price begins building a base here, the current decline may eventually be remembered as a major correction inside a much larger secular uptrend. The real technical problem would begin if that trend is decisively lost, because that would suggest the character of the structure that has been in place since 2023 is starting to change
Palantir shows a similar pattern, although its structure is younger. PLTR has respected the rising trend originating from the roughly $6 low in early 2023 multiple times. The first major interaction came in 2023, another important test followed later, and the 2026 pullbacks have continued to respect the same structure. This is no longer just a random line connecting two points. It has become a dynamic area where buyers have repeatedly returned during multi year corrections. The decline from the recent $210 peak is once again bringing Palantir back toward that trend. So the important question is not whether $210 marked a local top. The real question is whether the primary uptrend that has been in place since 2023 will continue to hold. For now, the answer is still yes. Price remains above the trend, and the long term higher low structure has not been fully broken. That means Palantir still looks more like an extended asset returning toward its primary trend than a confirmed long term reversal
Broadcom is at a different stage. Looking at AVGO over a much longer horizon, the secular uptrend dating back to 2009 remains clearly visible. After 2020, price did not simply continue respecting that original structure. It developed a steeper secondary trend. The acceleration that followed the 2022 and 2023 correction became the main driver of the 2024 and 2025 expansion. Broadcom is now pulling back from its highs, but price remains far above the broader long term trend. More importantly, the current correction is first bringing price back toward the faster trend that developed after 2022. That gives Broadcom two different technical layers of support. The first is the accelerated post 2022 trend. The second is the much larger secular structure that has been rising since 2009. Even if the first structure eventually fails, that would not automatically mean the entire long term trend has broken.
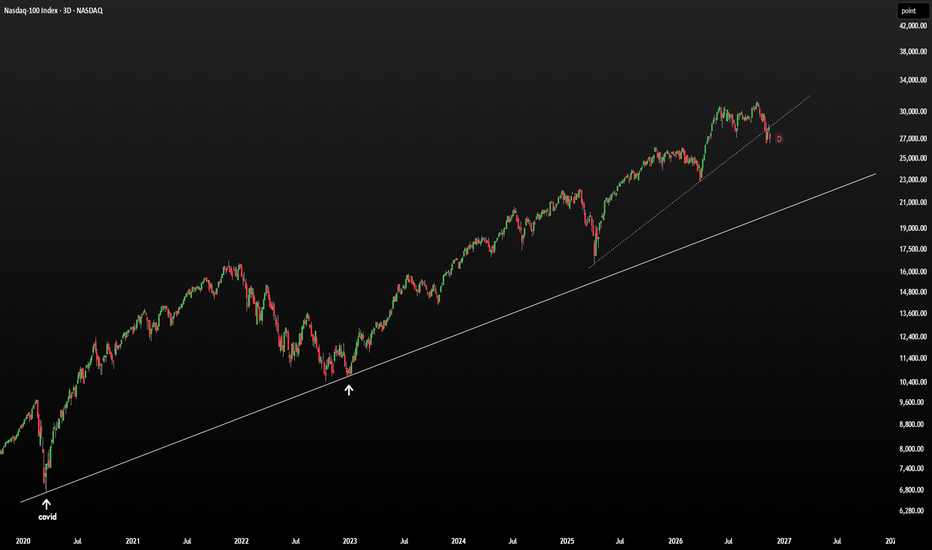
When the three charts are placed side by side, an interesting common pattern appears. NVIDIA, Palantir and Broadcom began their major advances at different times and on different scales, yet all three are now moving through a similar technical process. Price moved far away from its primary trend, momentum became heavily extended, a sharp reversal followed the peak, and price is now moving back toward long term trend support. That looks less like a confirmed bubble collapse and more like a major test of the underlying trend
A true secular trend reversal would usually require something more. I would want to see the major rising trends break, then see those former supports turn into resistance, followed by lower highs and eventually lower lows. That sequence has not yet been completed across these three charts. NVIDIA is approaching its primary trend. Palantir is testing its primary trend. Broadcom remains significantly above its broader secular structure. So from a technical perspective, the most important question is not how large the decline becomes, but where the decline stop
stock can fall 30 percent, 40 percent or even more and still preserve its long term bullish structure. Especially when price spent several years expanding far above its primary trend, large percentage corrections can be structurally normal. This is the main signal I will be watching across AI stocks from here. If NVIDIA and Palantir produce strong reactions from their primary rising trends, while Broadcom continues to hold its accelerated structure, the 2026 selloff may ultimately prove to be a major rebalancing inside the broader AI cycle. If NVIDIA loses its 2023 trend, Palantir breaks the structure originating from its 2023 lows, and Broadcom begins losing its multi year trend architecture, then the interpretation change
For now, the charts are not telling me that yet. AI stocks are falling, but the long term AI trend has not been technically broken. What we are seeing right now looks more like prices returning toward their underlying structures after several years of extraordinary expansion. From a technical perspective, the real decision zone is beginning here
Bonus Content: BTC/NVIDIA




