
BTC – The Power of One Trendline

BTC – The Power of One Trendline

Bitcoin / TetherUS BINANCE:BTCUSDT


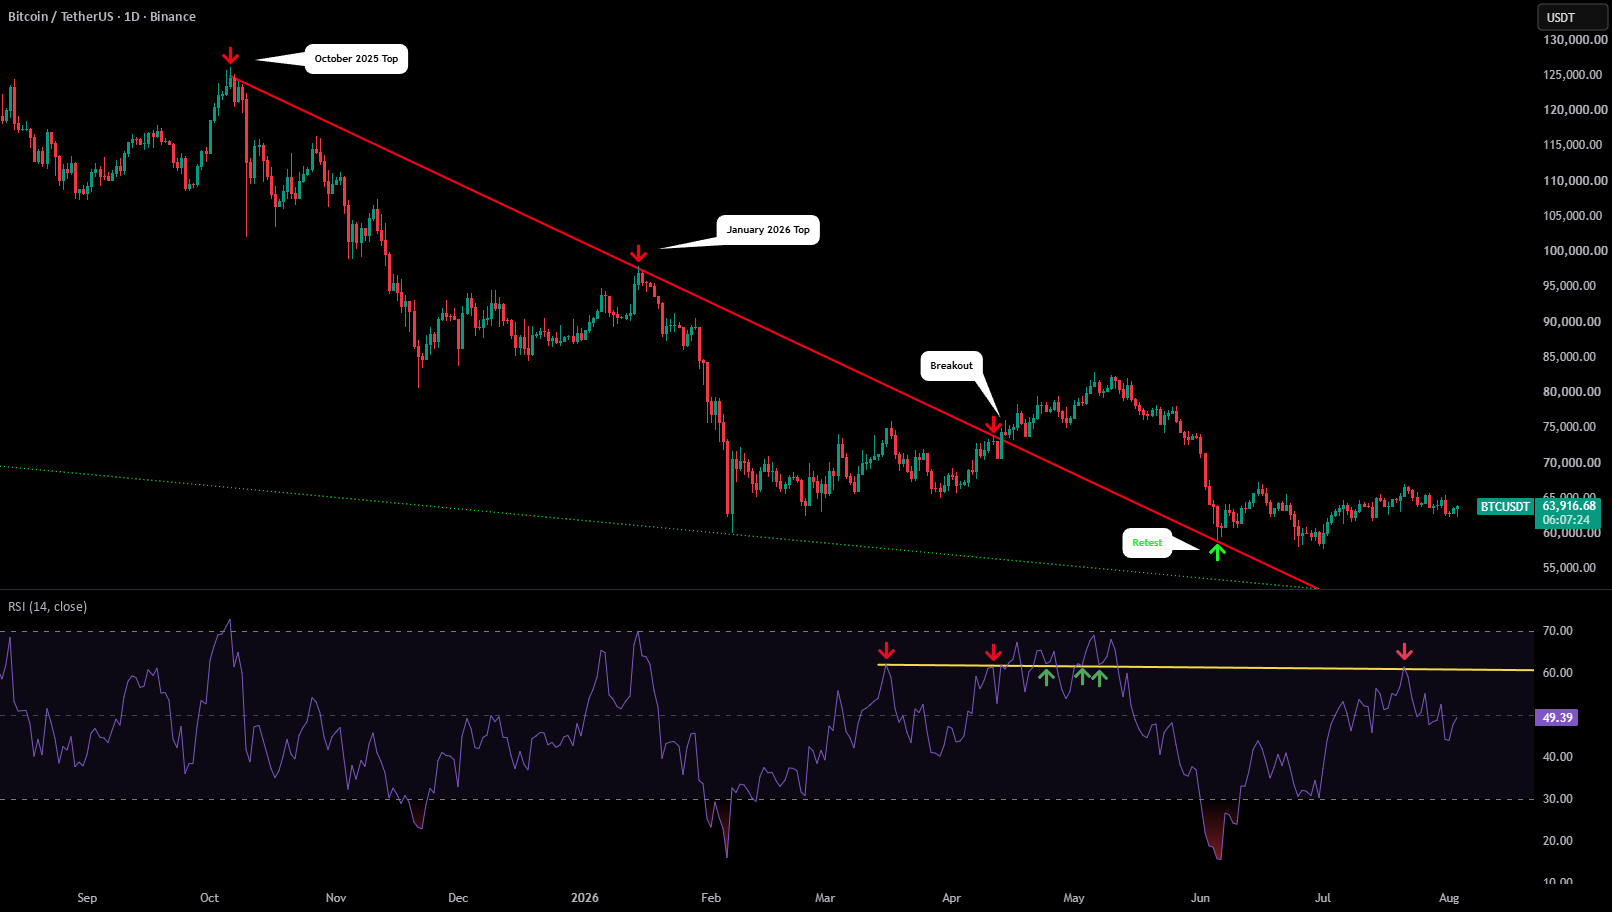
Here I want to take a look at the last year for BTC, specifically from the high on November 11, 2025 to the low on November 15, 2026.

The Key Trendline
On the logarithmic scale, something fascinating shows up over this period. One trendline has been the most significant of the past year. I have a solid orange trendline drawn from the wick highs and a dotted orange trendline drawn from the candle bodies, and both matter.

The solid orange trendline marked many of the tops through the 2026 bear market (red X’s) and recently caught the wick low of the current dump (green checkmark). The dotted orange trendline has caught most of the candle bodies. It has kept doing so on the current retests, as old resistance becomes new support.

Magic of Numbers
What I also find fascinating is that there are 369 days from the November 11 high to the November 15 low. If you study numerology, you know why that matters. As Nikola Tesla allegedly said: “If you only knew the magnificence of 3, 6, and 9, then you would have the key to the universe.”

The Similar Pattern
As most of you know, the all time high occurred in October 2025. A very similar pattern emerged from that high, which marked the $59k low before the move to $87k. For more context on that move, review this past idea:
Previous Article

November 2026 Back Half of Month Review Trading Strategy/Results

Next Article

SPY flushed to 728 while the model called a rip. Now what?

You might be interested in …

SOL/USDT – Bullish Trendline Liquidity Sweep & BOS Long Setup

SOL/USDT – Bullish Trendline Liquidity Sweep & BOS Long Setup SOL / TetherUS BINANCE:SOLUSDT Forex_King_0786 Solana (SOL/USDT) has shifted into a strong bullish structure on the 15-minute timeframe. After sweeping ascending Trendline Liquidity and establishing higher Swing Lows, price delivered a clean bullish Break of Structure (BOS) to confirm buyer dominance. Following a minor pullback into a high-probability demand zone, […]

Pfizer breaks below $28.50

Pfizer breaks below $28.50 Pfizer Inc. BATS:PFE FxPro – Pfizer broke support zone – Likely to fall to support level 27.00 Pfizer recently broke the support zone between the support level 28.50, the 38.2% Fibonacci correction of the upward impulse from the start of July and the daily up trendline from August. The level 28.50 capped the price at the […]

GOLD BELOW 3,600 – WILL 3,450 BE THE NEXT TARGET?

GOLD BELOW 3,600 – WILL 3,450 BE THE NEXT TARGET? GOLD / U.S. DOLLAR FX_IDC:XAUUSD BrianLionCapital Gold continues to face aggressive selling pressure, with XAUUSD trading around 3,555 after a sharp decline from the 3,729 resistance area. As the trading week approaches its close, the H1 chart shows a clear bearish structure, with successive lower highs, lower lows and repeated […]

Deixe um comentário

O seu endereço de e-mail não será publicado. Campos obrigatórios são marcados com *
